

Here's a pattern you've probably lived through.
You close a $25K AI consulting engagement. The scope is clear. You deliver the automation. The workflows run. The client's team uses the tools. Everything, technically speaking, works.
Then the check-in calls get shorter. Emails go from enthusiastic to transactional. And when the engagement ends, the renewal conversation goes nowhere. The client "needs to think about it" — and you're left wondering what went wrong.
What went wrong is this: you never defined what success looked like, so the client couldn't see it.
This isn't a delivery problem. It's a measurement problem. And it's the single most predictable reason AI consulting engagements fail to convert into renewals, upsells, or referrals.
The numbers back this up. McKinsey's 2025 State of AI survey found that only 39% of organizations could attribute any EBIT impact to their AI initiatives. The other 61%? They're spending money on AI and feeling like something is happening — but they can't prove it. When the board asks for a return report, feelings don't hold up.
Meanwhile, scope creep eats your margin from the other direction. PMI research shows scope creep affects 52% of all projects, making them 2.5x more likely to fail. And according to RAND Corporation's 2024 analysis, more than 80% of AI projects fail to deliver their intended business value — roughly twice the failure rate of non-AI IT projects.
Both problems — the ghosting and the scope creep — share the same root cause: no repeatable framework for defining, tracking, and reporting success.
This post is that framework. Three phases. Specific metrics. Real cadences. Built for consultants who've already closed deals and need to deliver in a way that makes the next engagement obvious.
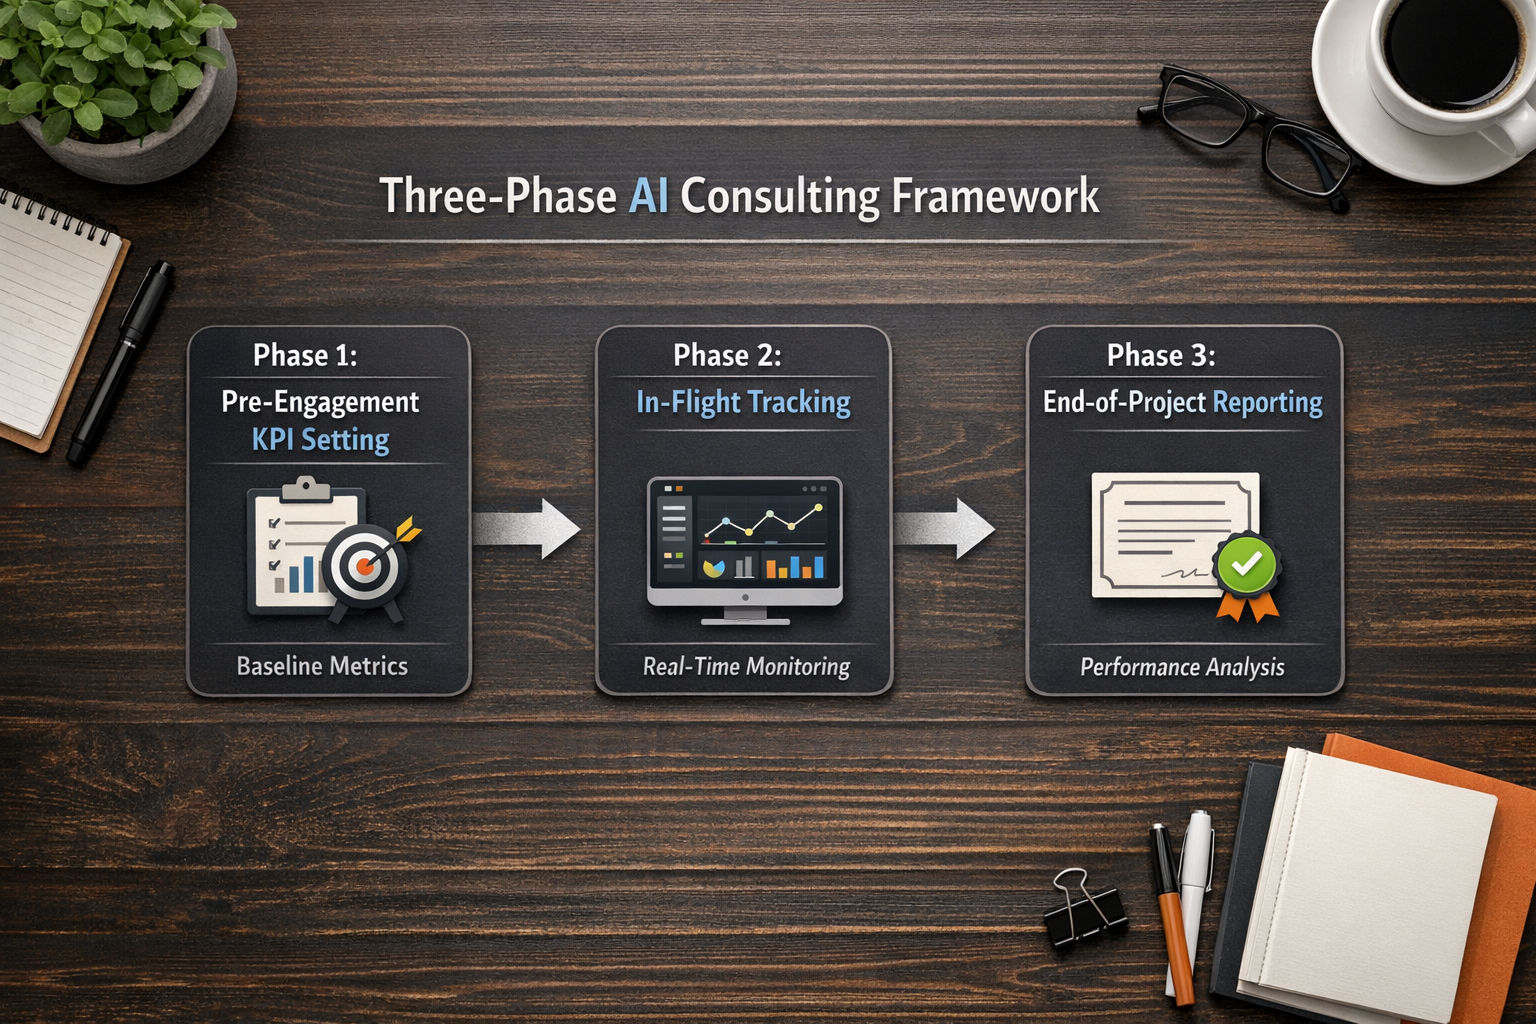
Phase 1: Pre-Engagement KPI Setting — The Defensible Starting Point
The window to define success closes fast. The moment the contract is signed, both you and the client have an unspoken assumption about what "done" looks like. Most consultants never check whether those assumptions match. By the time the mismatch surfaces — usually at the mid-point check-in or worse, the final deliverable — the relationship is already damaged.
Phase 1 has three parts: baseline capture, success definition, and KPI agreement.
Baseline Capture: Measure Before You Build
You can't prove impact without a before picture. This is non-negotiable.
For every process you're going to touch with AI, capture the current state in hard numbers. Not estimates. Not "the team says it takes about an hour." Actual measurements over a defined window.
The minimum baseline for any AI consulting engagement:
- Time per process step: Timed over at least 10 runs. Capture the full workflow — not just the task itself but context switching, review loops, and rework.
- Error rate: What percentage of outputs require correction? Document the types of errors, not just the frequency.
- Cost per process: Fully loaded — labour cost × time, plus any direct costs (software licenses, third-party services).
- Volume: How many times per week or month does this process run?
AI Smart Ventures, an AI consulting practice that has served thousands of organizations, puts it bluntly: "Start by documenting one process baseline before any AI work begins." Their recommended window is 30 days of measurement before the first line of code or configuration.
This is where having automated baseline generation changes the game. ConsultKit's AI readiness report produces a scored, data-backed baseline across multiple dimensions — process maturity, data readiness, team capability — before you write a single line of your proposal. Instead of spending the first two weeks of an engagement manually gathering baselines, you walk into the kickoff call with defensible numbers already in hand. The client sees the gaps before you point them out. That shifts the dynamic from "trust me, this will work" to "here's exactly where we're starting and what we're fixing."
Success Definition: Outcomes, Not Deliverables
Every AI consulting scope of work should answer one question before anything else: What specific business outcome, expressed as a number, will the client see when this engagement succeeds?
Not "build a chatbot." Not "deploy an automation pipeline." Not "deliver a strategy document."
"Reduce manual data entry hours by 60% within 90 days of deployment." That's a success definition.
The gap between "deliverables" and "outcomes" is where client relationships go to die. You deliver what the contract says. The client doesn't get what they actually needed. Both parties leave technically satisfied and operationally disappointed.
As we've covered in our AI consulting scope of work framework, the scope document isn't admin — it's margin protection. The same applies to your KPI definitions. They're the boundary between a project that stays on rails and one that expands until your margin disappears.
KPI Agreement: Get It in Writing
Pick 3 to 5 metrics. No more. Every metric you add dilutes focus and creates ambiguity about what matters most.
Agility at Scale, an AI strategy consultancy, recommends: "For each AI initiative, select 3 operational metrics, 2 business metrics, and 1 risk metric." That's 6 total — a reasonable ceiling for enterprise clients. For mid-market engagements, 3 to 5 is plenty.
Each KPI needs three things in writing before work starts:
- The baseline value (captured above)
- The target value (what success looks like, with a timeline)
- The measurement method (how it will be calculated, from what data source, at what cadence)
If you can't agree on these three things for a given metric, strike it. A metric without a baseline, a target, and a measurement method isn't a KPI — it's a wish.
"Define success before work starts, using one to three business KPIs." — AI Smart Ventures
Agreeing to KPIs the client can't actually measure. If the client has no way to pull baseline data — no time tracking, no CRM reporting, no process documentation — your engagement will end with an anecdote, not a number. If the data doesn't exist, make data capture part of Week 1 deliverables, or pick a metric the client already tracks.
Phase 2: In-Flight Tracking — Cadences, Leading Indicators, and What to Keep Internal
Once the engagement is running, the KPIs move from a planning document to an operating rhythm. This phase is where most consultants either over-communicate (drowning the client in noise) or under-communicate (going silent between milestones). Both are mistakes.
The Tracking Cadence
Three rhythms, three purposes:
Weekly: Operational pulse (internal-facing, with a client summary). Track leading indicators — workflow runs completed, tool adoption rate, error flags, data quality issues. You need this granularity to catch problems before they become client problems. The client gets a digest version: what shipped, what's next, any decisions needed. Prodinit's AI consulting project management framework recommends a weekly update of max 200 words, plus same-day escalation for any client-side blockers.
Monthly: KPI trend review (client-facing). This is the meaningful conversation. Show each KPI against its baseline, its target, and the trajectory. Use a simple format: metric, baseline, current, target, trend arrow. No slide deck required — a one-page dashboard is more powerful than fifteen slides. According to enterprise AI ROI guidance, organizations with dedicated AI measurement capabilities report 3.2× higher confidence in their AI investments. Your monthly review is that measurement capability for your client.
Quarterly: Strategic review (client-facing, with leadership). Zoom out. What's the aggregate impact across all workflows? What's the projected annualized value? What's working that should be expanded? What's not working and why? This is also where you surface forward-looking recommendations — the ones that become the next engagement.
Leading vs. Lagging: What to Surface, What to Keep Internal
Here's a distinction that saves engagements: leading indicators are for you. Lagging indicators are for the client.
Leading indicators — adoption rates, workflow runs, model accuracy trends, data quality scores — predict whether the lagging indicators (cost savings, revenue uplift, error reduction) will eventually arrive. They're your early warning system. If adoption is 30% in week four, you know the month-two productivity numbers won't hit.
You track leading indicators obsessively. You report them to the client selectively — only when they explain a trend or justify a course correction.
The client's monthly report should focus on lagging indicators: the business outcomes. Did manual hours go down? Did errors drop? Did costs per process decrease?
This separation matters because clients who see leading indicators without context panic. A model accuracy dip from 92% to 87% in week three may be normal — part of the training cycle. But if the client sees it without the explanation, they lose confidence. Surface the business outcome. Keep the technical noise internal unless it requires a decision.
The Adoption Metric That Actually Matters
Most consultants track "users onboarded" or "accounts created." These are vanity metrics. The metric that correlates with business impact is active user rate: what percentage of intended users engage with the AI tool at least weekly?
Hashmeta's 2026 AI consulting KPI framework sets the benchmark at 70–80% active user rate. Below 50%, the engagement is at risk regardless of technical quality — because unused tools don't create value. The Hummingbird AI consulting practice puts it directly: "AI projects often fail not because of technology, but due to low adoption."
Track active user rate weekly. If it's trending down, intervene before the monthly review — not during it.
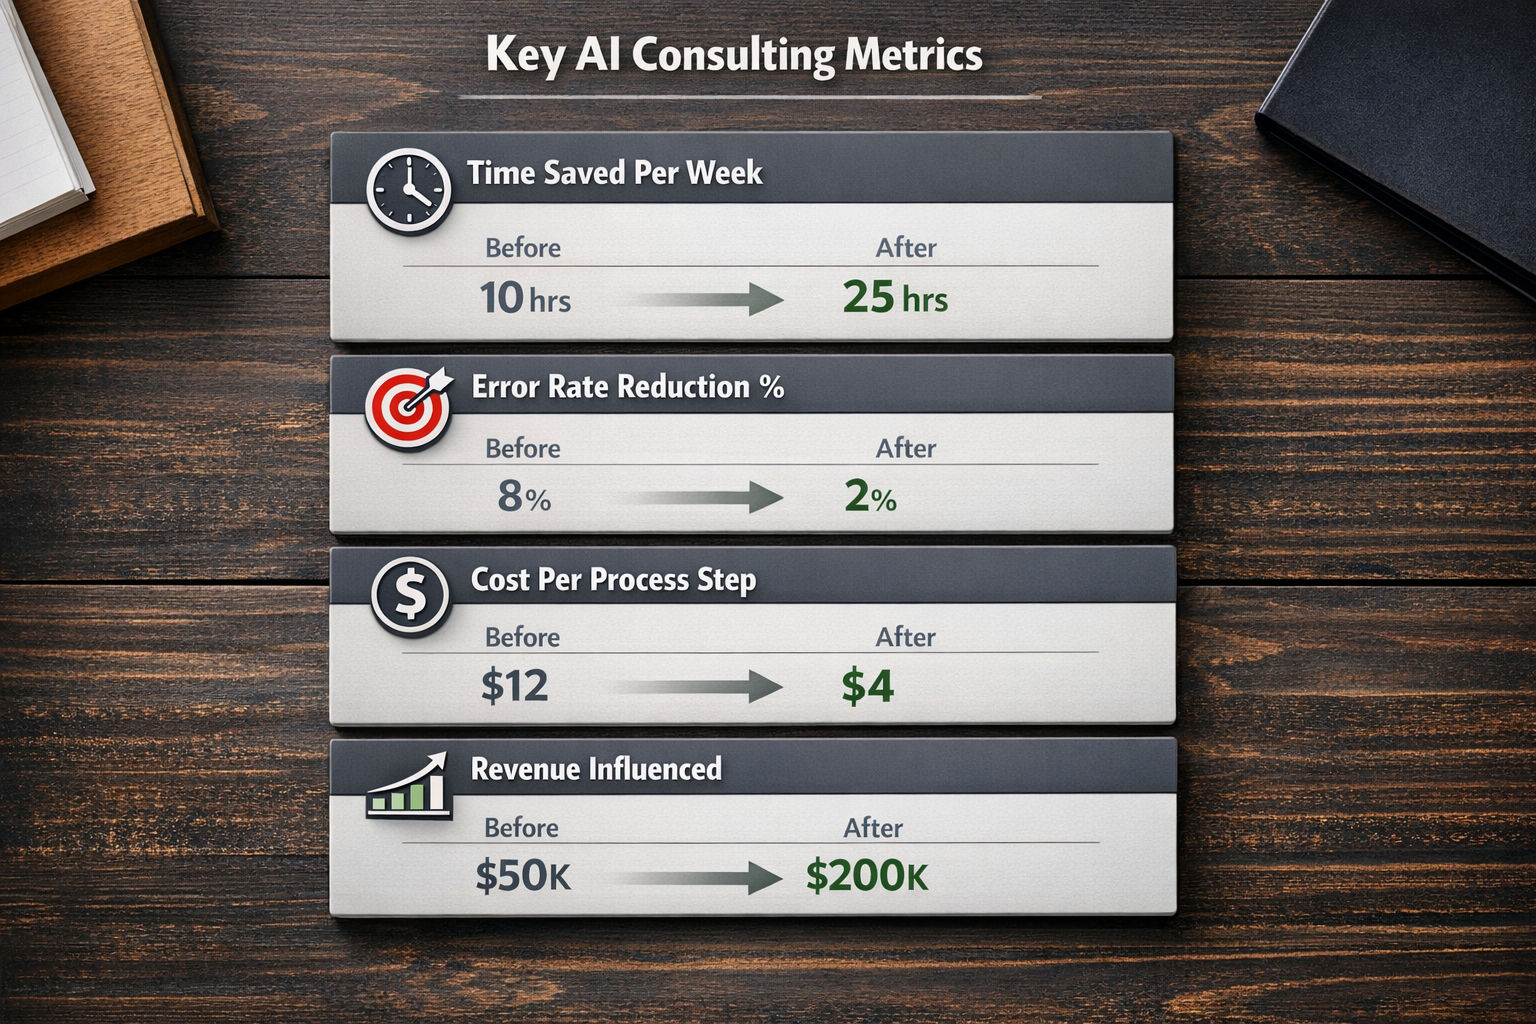
The KPI Stack: Four Metrics That Prove Value in Any Engagement
Different clients care about different outcomes. But across every AI consulting engagement — automation, strategy, governance, implementation — four metrics consistently prove value. You don't need all four for every project. Pick the ones that match the engagement scope and measure them rigorously.
1. Time Saved Per Week
What it measures: Hours recovered from AI-assisted workflows versus the manual equivalent.
How to calculate it:
(Manual time per run − AI-assisted time per run) × Weekly runs = Weekly hours saved
Don't use estimates. Time actual runs. And account for review and editing time in the AI-assisted workflow — the raw output time is misleading if the team spends 20 minutes editing what the AI produced in 30 seconds.
What good looks like: Forrester Research benchmarks AI automation savings at 4.2 hours per knowledge worker per week. DojoLabs, an AI consulting firm focused on SMBs, reports 12–18 hours saved per week per workflow among their FinTech and SaaS clients. A single automated pricing workflow that saves 15 hours per week at $75/hour fully loaded cost produces $58,500 in annualised labour savings.
When to use it: Every engagement. Time is the universal denominator.
2. Error Rate Reduction %
What it measures: The percentage of outputs requiring correction or rework before and after AI implementation.
How to calculate it:
(Pre-AI error rate − Post-AI error rate) ÷ Pre-AI error rate × 100 = Error rate reduction %
Define "error" precisely. For a document workflow, it might be "outputs requiring human correction before client delivery." For a data pipeline, it might be "rows with formatting or calculation errors detected in QA." Ambiguous definitions produce meaningless numbers.
What good looks like: DojoLabs' benchmark: clients average a 34% error rate on multi-step AI tasks before engagement, dropping to under 8% after. That 26-point reduction saved the average SMB $14,000 per quarter. Gartner finds that companies above 92% accuracy generate 2.4× more revenue per AI transaction than those below 80%.
When to use it: Any engagement involving document processing, data entry, classification, or content generation.
3. Cost Per Process Step (Before vs. After)
What it measures: The fully loaded cost of completing one instance of a target process — before and after AI intervention.
How to calculate it:
(Labour time in hours × fully loaded hourly rate) + direct costs = Cost per process step
The fully loaded hourly rate matters. Using employee salary alone understates the real cost. Include benefits, overhead, tools, and management time. For most knowledge workers in Western markets, $65–$95/hour is a reasonable fully loaded range.
What good looks like: AI-enabled B2B agencies showed a $127 cost per MQL versus $189 for traditional agencies — a 33% reduction (2025 B2B marketing agency benchmarks). Phos AI Labs' measurement framework shows that tracking three categories (direct time recovery, quality improvement, capacity expansion) captures value that single-metric approaches miss. They estimate most SMBs miss 60% of total AI value because they only track cost savings.
When to use it: Engagement involving process automation, customer support, or marketing operations.
4. Revenue Influenced
What it measures: Revenue that can be attributed — directly or through defensible estimation — to the AI implementation.
How to calculate it: This one requires more judgement. Attribution models range from simple (incremental revenue from AI-personalised campaigns vs. control) to complex (counterfactual modelling). For most consulting engagements, a simple approach works:
- Direct: Incremental sales from AI-driven recommendations or personalisation.
- Indirect: Revenue protected through reduced churn (at-risk accounts × ACV × churn reduction %).
- Capacity-driven: Additional revenue from capacity freed by automation (e.g., account manager handles 20% more clients at same headcount).
What good looks like: IDC research cited by Microsoft reports an average ROI of $3.70 for every $1 invested in AI, with the top 5% achieving $10 for every $1. Top-quartile AI adopters report 6–10% revenue uplift attributable to AI in marketing and sales. DojoLabs tracked one e-commerce client through a 90-day engagement where better AI pricing accuracy alone added $220,000 in net revenue.
When to use it: Sales, marketing, personalisation, churn reduction, or pricing optimisation engagements.
| KPI | Baseline Example | Target Example | Measurement Method | Best For |
|---|---|---|---|---|
| Time Saved/Week | 12 hrs/manual | 4 hrs/AI (67% reduction) | Time tracking + workflow logs | All engagements |
| Error Rate Reduction % | 34% error rate | <8% (76% reduction) | QA sampling per 100 outputs | Document, data, content work |
| Cost Per Process Step | $42/step | $18/step (57% reduction) | Labour cost × time + direct costs | Automation, support, marketing |
| Revenue Influenced | Baseline attribution | 8-12% uplift over control | A/B testing or cohort comparison | Sales, marketing, churn work |
The four-metric KPI stack with example baselines, targets, and measurement approaches. Select the metrics that match your engagement scope.
Phase 3: End-of-Project Reporting — Making Renewals Automatic
If you've run Phase 1 and Phase 2 properly, Phase 3 is almost mechanical. The data already exists. The trends are already visible. The client has seen progress every month. The close-out report is simply the final chapter of a story they've been reading all along.
But most consultants treat the end-of-project report as a summary. That's a missed opportunity. The close-out report should be a bridge — not a goodbye.
The Structure of a Renewal-Ready Close-Out Report
Section 1: Executive Summary (one page, business language only). What changed, by how much, and why it matters. No technical jargon. The CFO should understand this page without context.
Section 2: Baseline vs. Current — Every KPI. Side by side. Baseline value, target value, final value, percentage change. A table works better than paragraphs.
Section 3: Trend Lines (not snapshots). Show each KPI over time. A metric that improved steadily for three months tells a different story than one that jumped in the final week. Trends build confidence. Snapshots raise questions.
Section 4: Attribution and Exceptions. What results came from AI versus unrelated changes? What didn't work, and why? A report that only shows wins can't be trusted. The exception section demonstrates rigour and builds credibility for the wins you do claim.
Section 5: Forward-Looking Recommendations. Based on current data, what should happen next? This is where the next engagement lives. It should be specific: "Based on the 67% reduction in data entry time, extending this workflow to the finance team's reconciliation process would save an estimated 22 additional hours per week. Scope, timeline, and investment follow on the next page."
The Bridge Close
The final conversation isn't a handoff. It's a transition.
Schedule a 60-minute close-out call — not a 30-minute one. Walk through the report. Celebrate the wins. Be direct about what didn't work and what was learned. Then pivot: "Here's what the data says should happen next."
As covered in our post-implementation check-in framework, the 30/60/90-day cadence after project close is where renewals, upsells, and referrals actually materialise. The close-out report is the foundation — the check-in cadence is the follow-through.
"AI consulting engagements without a measurement framework produce a feeling of ROI rather than evidence of it. Feelings are convincing until someone asks for the number." — Phos AI Labs
What to Do When Results Are Lagging
Even with a solid KPI stack, some engagements underperform. The model doesn't reach target accuracy. Adoption stalls. The time savings are smaller than projected.
This is normal. What separates great consultants from average ones isn't the absence of underperformance — it's how they handle it.
The Rule: Proactive Communication Beats Client Discovery — Every Time
If a KPI is trending below target, the client should hear it from you first. Not from their internal dashboard. Not from a team member who noticed. From you, with context, options, and a plan.
Threecus, an AI consulting firm, states it plainly: "When a model performs below expectations or data quality causes delays, communicate proactively — do not wait until the deadline passes. Clients forgive problems when they are informed early."
The framework for the conversation:
-
Lead with the business outcome, not the technical problem. "We're tracking toward a 12% reduction in manual reviews instead of the 30% we targeted" — not "the model's F1 score is plateauing at 0.71."
-
Diagnose the cause, briefly. "The primary driver is noisy labels in the historical data. About 40% of the training examples have inconsistent categorisation."
-
Present options as trade-offs, not refusals. Use the "Pick Two" framework: fast, cheap, comprehensive — pick two. Manali Patel, an AI consultant, recommends making trade-offs visible: "Show them the triangle. If they want fast and cheap, scope shrinks. If they want fast and comprehensive, price grows. Make the tradeoff visible on paper."
-
Provide a revised forecast with a specific decision required. "To reach closer to 30%, we can either extend the timeline two weeks for additional data cleaning, or reduce scope to the highest-volume use cases and hit the original deadline. Which is more important given your launch date?"
-
Document the decision. If the client chooses to reduce scope to meet a deadline, that's now the agreed outcome — not a failure to deliver the original target.
Most clients don't leave because results lagged. They leave because results lagged and they found out on their own.
If results are lagging and the root cause is data quality, you have a defensible position: the baseline assessment flagged this. If you ran a proper readiness assessment before the engagement, the data quality gaps were documented before work started. That transforms the conversation from "the consultant didn't deliver" to "the pre-identified data issues are affecting performance as expected — here's the remediation path." This is why baseline generation before engagement isn't a nice-to-have. It's your insurance policy.
The Stack in Practice: One Page That Runs Your Engagement
Here's what the full KPI stack looks like as a one-page operating dashboard. Fill this out before the kickoff call. Update it monthly. Use it as the spine of every client conversation.
Engagement: [Name]
Success Definition: [One sentence. Business outcome, not deliverable.]
| KPI | Baseline | Target | Month 1 | Month 2 | Month 3 | Final | |-----|----------|--------|---------|---------|---------|-------| | Time saved/week | | | | | | | | Error rate % | | | | | | | | Cost/process step | | | | | | | | Revenue influenced | | | | | | | | Active user rate % | — | >70% | | | | |
Leading indicators (internal only): Workflow adoption %, model accuracy trend, data quality flags, client-side blocker log.
Risk Register: Top 3 risks to hitting targets, current status, mitigation actions.
That's it. One page. No deck. No narrative fluff. The numbers tell the story.
The Competitive Moat You're Not Using
Here's the uncomfortable reality of the 2026 AI consulting market: almost nobody can prove their work produced value.
The MIT NANDA report found that 95% of generative AI pilots fail to deliver measurable P&L impact. S&P Global's 2025 survey showed 42% of companies abandoned most AI initiatives — up from 17% in 2024. The abandonment rate more than doubled in a single year.
Why? Not because the technology doesn't work. Because nobody defined, tracked, and reported success in a way the business could recognise.
If you're the consultant who can hand a client a one-page KPI dashboard showing a 67% reduction in process time, a 76% drop in error rates, and a projected $58,500 in annualised savings — all tracked from a defensible baseline — you're not competing on price anymore. You're selling certainty.
That's the real moat. Not your technical skills. Not your tool stack. Your measurement framework.
Build it before the next engagement starts.
